What is WAL backpressure, and why does ClickHouse Managed Postgres need it?
How ClickHouse Managed Postgres uses WAL-aware backpressure to slow client writes, protect disk space, and let the archiver recover.
📝 摘要
本文详细介绍了 ClickHouse Managed Postgres 如何通过 WAL 感知的背压(backpressure)机制防止 WAL 积压导致磁盘满并引发 PANIC 崩溃。Postgres 的所有变更先写入 WAL(Write-Ahead Log),再由归档器将已完成的 WAL 段上传至对象存储以支持时间点恢复(PITR)。当写入速度超过归档速度时,WAL 段不断堆积,磁盘空间耗尽会导致实例崩溃。ClickHouse 的解决方案是:一个 systemd 定时器每 15 秒检测待归档段数,通过 cgroup v2 I/O 控制器对客户端写入带宽进行分级限流(100 段→80%、500 段→50%、1000 段→20%),同时让归档器、检查点、WAL 写入器等"排涝路径"保持全速运行。该机制完全在数据面运行,即使控制面不可用也能自我保护。实测显示,在 pgbench 压力下,磁盘占用从未超过 33%,全程无需人工干预。
核心概念: WAL 背压是一种通过分级限流客户端写入、保护排涝路径全速运行的自保护机制,用几分钟的吞吐量下降换取实例永不因 WAL 积压而崩溃。
关键技术栈 / 关键要点:
- WAL(Write-Ahead Log) — Postgres 所有变更先写入 WAL 再落表,归档器上传段至对象存储以支持 PITR
- 分级背压限流 — 100/500/1000 待归档段三档阈值,对应 80%/50%/20% 的磁盘写入带宽上限
- cgroup v2 I/O 控制器 — 利用 Linux cgroup 将进程分为 immune(排涝路径)和 throttled(客户端后端)两组,仅限流后者
- 数据面自治 — 背压机制完全在数据面运行,systemd 定时器 + cgroup 无需控制面参与
- 排涝路径免疫 — 归档器、检查点、WAL 写入器、日志器保持全速运行,"不能限流治病的药"
- 实测验证 — m7i.2xlarge + gp3 500MB/s,pgbench 48 客户端,峰值 3433 段/53 GiB 积压,磁盘从未超过 33% 满载
关键结论 / 实践建议: 几分钟的写入降速可避免实例因 WAL 磁盘满而 PANIC 崩溃;分级限流阈值精确触发,排涝路径全程全速,积压清除后限流自动解除。所有 ClickHouse Managed Postgres 服务器默认启用此机制。
What is WAL archiving, and why would we deliberately throttle our database's writes? All changes to Postgres land in the write-ahead log (WAL) before they touch a table, and our managed Postgres uploads each finished WAL segment to object storage to make point-in-time recovery possible. Postgres may not delete a segment until its upload succeeds, so when the workload writes faster than the archiver ships, WAL piles up until the disk fills. Postgres treats a full WAL disk as a PANIC: the instance goes down.
Backpressure from the data plane
ClickHouse Managed Postgres responds with backpressure. A systemd timer counts the pending segments every 15 seconds and caps Postgres's write bandwidth with the cgroup v2 I/O controller. The caps are fractions of the disk's provisioned throughput, and they tighten as the backlog deepens:
| Pending segments | Write cap | On a 500 MB/s disk |
|---|---|---|
| 100 | 80% of baseline | 400 MB/s |
| 500 | 50% of baseline | 250 MB/s |
| 1,000 | 20% of baseline | 100 MB/s |
Slower writes mean less WAL per second, and the archiver gains ground. All of this happens on the data plane, so even if the control plane is down or unreachable, the database keeps protecting itself.
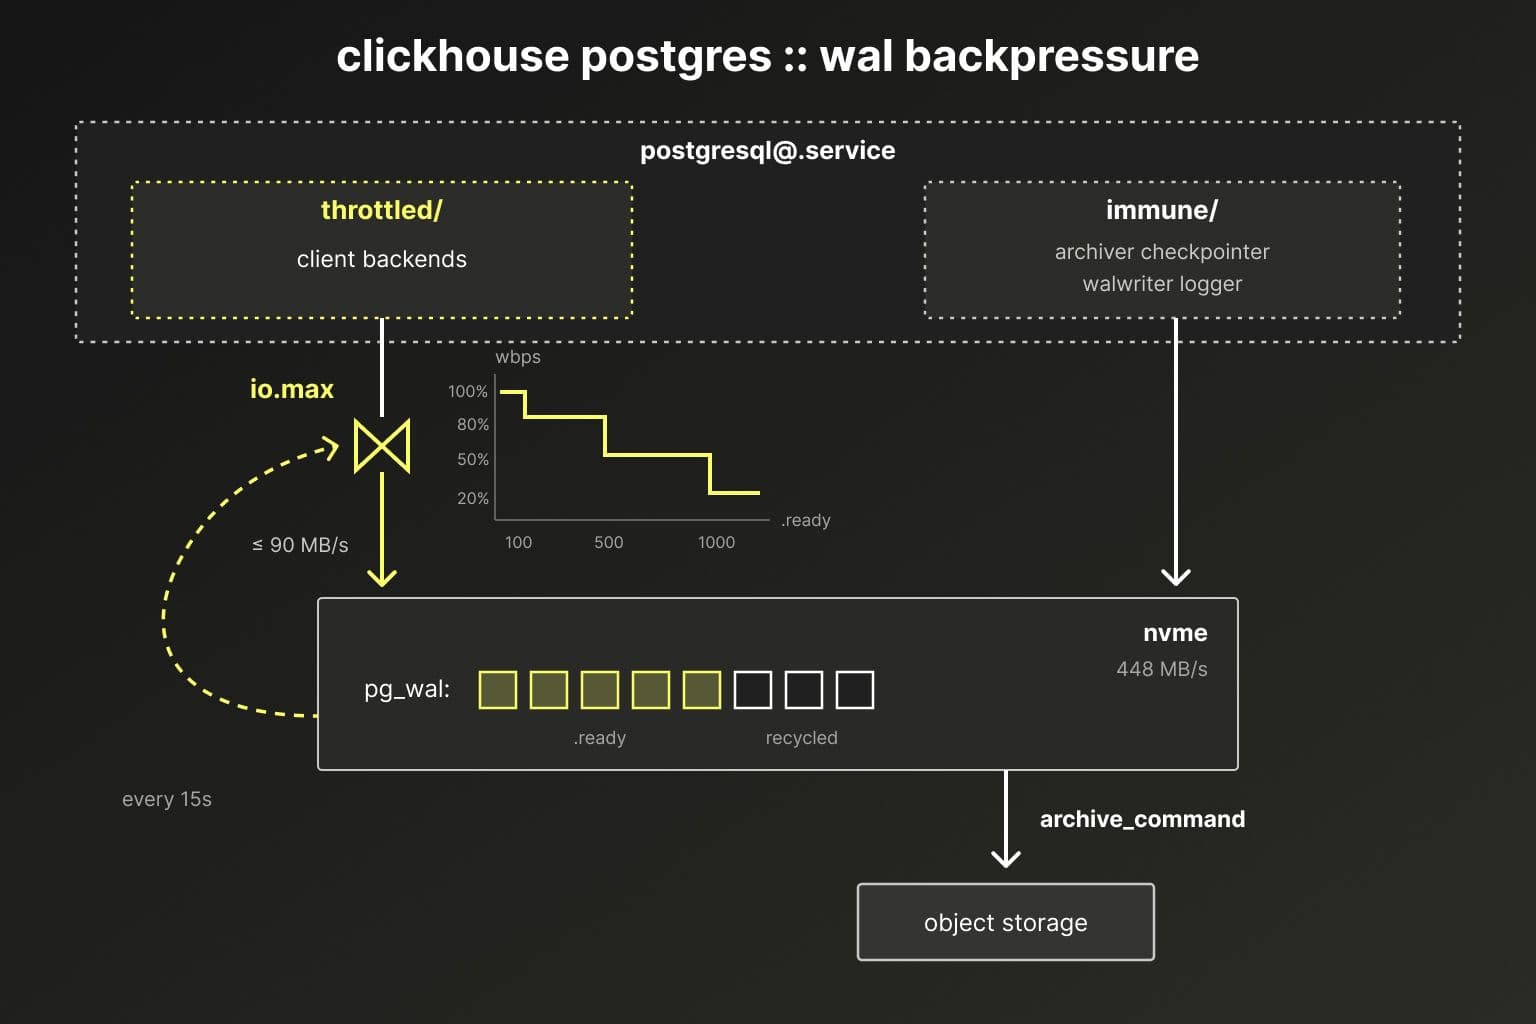
WAL backpressure architecture: client backends are write-throttled while the archiver, checkpointer, WAL writer, and logger retain full disk throughput
Don't throttle the cure
A cap on the whole service would also cap the cure: the archiver draining the queue, the checkpointer that lets old WAL be deleted, even the logger the archiver writes through. So the throttle splits the cgroup in two. Each Postgres process announces its role in its process title, so the drain path is sorted into an immune group and every client backend into a throttled one. Only the throttled group is capped, and reads are never capped at all.
Seeing it in action
We ran the mechanism on a single EC2 box and let it fight a deliberately backed-up archiver. The setup:
- Box: m7i.2xlarge (8 vCPU, 32 GB), Ubuntu 24.04, Postgres 16.
- Data disk: a dedicated gp3 volume provisioned at 500 MB/s, which is the throttle baseline, so the tiers work out to 400, 250, and 100 MB/s.
- Throttle: the production throttle class, verbatim, on a 15-second systemd timer, with
Delegate=yeson the Postgres unit so it can manage the sub-cgroups. - The backed-up object store: an
archive_commandrate-limited to 4 MB/s, one quarter of a segment per second. At minute 20 the limit is removed, simulating the moment object storage recovers. - Workload: pgbench simple-update, 48 clients, scale 300, for 35 minutes.
What happened, in order:
- Before the benchmark started, bulk-loading the pgbench tables had already pushed the backlog past 100 segments, and the 80% cap was in force at t=0 with 224 segments pending. Bulk loads are exactly the workloads that outrun archiving.
- Minute 1.9: backlog crossed 500, cap dropped to 50%.
- Minute 4.7: backlog crossed 1,000, cap dropped to 20%. The backlog was growing at about 170 segments a minute, roughly 45 MB/s of WAL.
- Minutes 0-20: pgbench stepped down with each tier: a 22,000 TPS burst at the start, 12,800 under the 80% cap, 11,800 under 50%, 9,600 under 20%.
- Minute 20: the "object storage" recovered with the backlog at its peak, 3,433 segments, 53 GiB of retained WAL.
- Minutes 20-23.7: the immune archiver drained about 850 segments a minute at full disk speed while the workload kept running under its cap.
- Minute 23.8: backlog back under 100; the timer removed the throttle on its next pass, and the count hit zero moments later. pgbench settled at 12,200 TPS with the archiver keeping pace.
- Throughout: the data disk never passed 33% full, and no human was involved at any point.
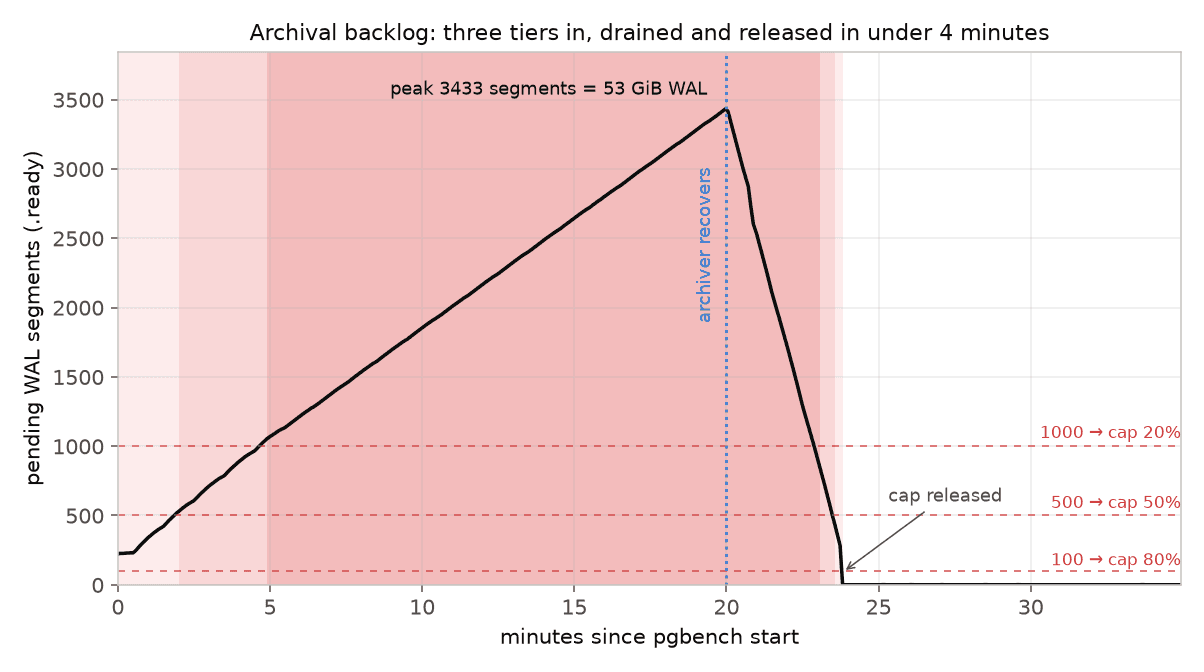
WAL archival backlog through the incident
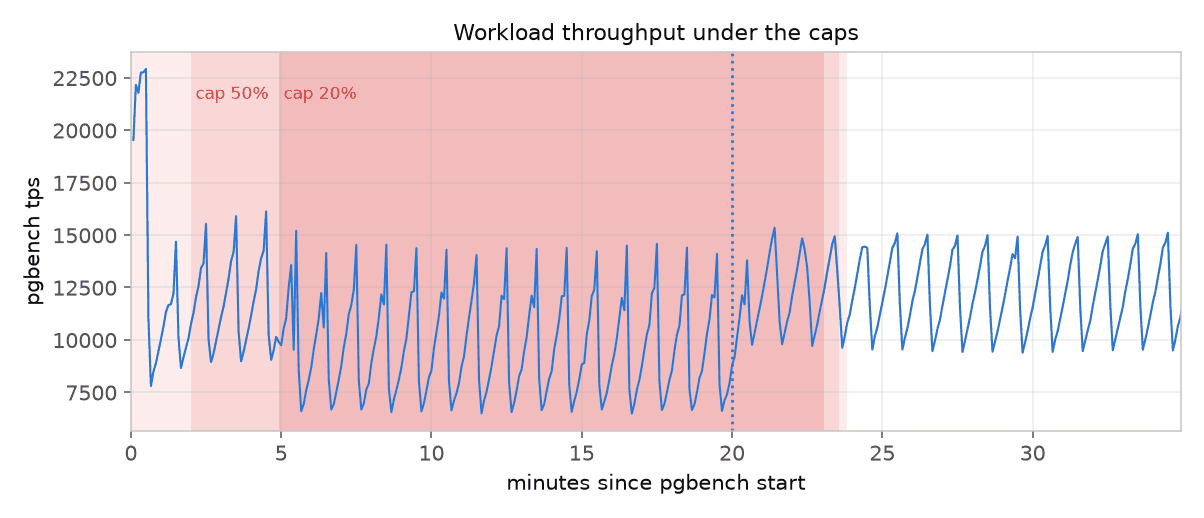
pgbench throughput as the tiers engage
The classification is visible in the cgroup filesystem. Ten minutes in, the immune group holds exactly the drain path, sorted there by process title, including the archive_command children the archiver spawned. The 48 client backends sit in the throttled group, and the literal io.max shows the 20% cap applies to writes only:
== immune ==
4679  /usr/lib/postgresql/16/bin/postgres -D /dat/16/data
4680  postgres: 16/main: checkpointer
4681  postgres: 16/main: background writer
4683  postgres: 16/main: walwriter
4685  postgres: 16/main: archiver archiving 00000001000000000000009E
8354  pv -q -L 4m pg_wal/00000001000000000000009E

== throttled ==
4684  postgres: 16/main: autovacuum launcher
4973  postgres: 16/main: postgres bench [local] COMMIT
4974  postgres: 16/main: postgres bench [local] COMMIT
      ... 46 more client backends ...

$ cat throttled/io.max
259:1 rbps=max wbps=104857600 riops=max wiops=max
One caveat in this run, this workload's bytes are almost entirely WAL, and commits ride through the immune WAL writer, so the caps cut throughput much harder than they cut WAL production, which fell only about 10%. The throttle buys time against the disk; how much depends on how data-heavy the writes are.
The takeaway
A few minutes of slower workload buys an instance that never writes itself to death. The tiers engage exactly at their thresholds, the drain path runs at full speed through the whole incident, and the cap releases itself the moment the backlog clears. Every ClickHouse Managed Postgres server ships with this by default.
Try Postgres managed by ClickHouse
ClickHouse + Postgres has become the unified data stack for applications that scale. With Managed Postgres now available in ClickHouse Cloud, this stack is a day-1 decision.